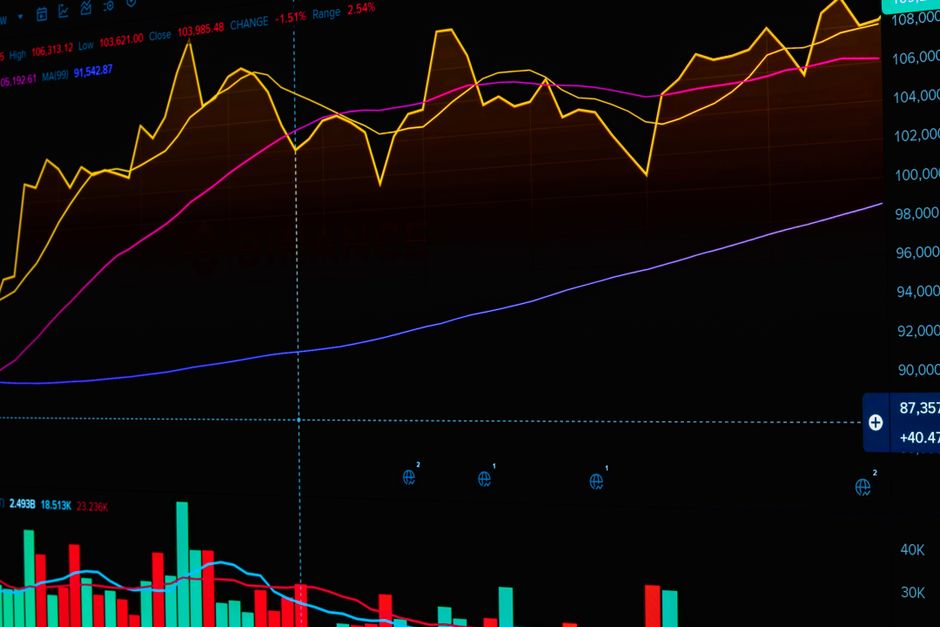
Nvidia (NVDA) - Market Analysis
As one of the leading players in the technology sector, Nvidia's stock performance has been under scrutiny lately. In this comprehensive analysis, we will delve into the technical, news, and historical aspects of NVDA to provide a 360-degree view of its market dynamics.
Trading Signal: HOLD (MODERATE)
The trading signal is based on the MACD indicator, which currently stands at 3.77. This positive reading suggests that Nvidia's stock has been experiencing bullish momentum in recent trading sessions. However, with a moderate hold signal, investors should exercise caution and monitor the stock's performance closely.
Technical Analysis
Our technical analysis reveals a complex picture of NVDA's price action. Here are some key findings:
- Price Action: The current price of $217.09 indicates that NVDA has been trading in a tight range recently.
- Trend Analysis: The EMA 12 ($223.63) is above the EMA 26 ($219.86), indicating a short-term bullish trend. The SMA 50 ($222.94) is also above the SMA 200 ($203.12), suggesting a medium-term uptrend.
- Support and Resistance Levels: We identified support levels at $210.00 and $205.00, while resistance levels are at $225.00 and $230.00.
- Momentum Indicators: The RSI (14) is currently at 38.63, indicating that NVDA is oversold but not extremely so. This suggests that the stock may be due for a bounce. The MACD is also positive, with a reading of 3.77.
- Volume Analysis: The current volume of 98,236,684 shares traded is relatively high compared to recent trading activity.
News & Market Sentiment
Our news analysis reveals mixed sentiment towards NVDA:
- AI Selloff: The AI selloff has led to a $350 billion loss in one week, indicating significant market impact.
- Quantum Computing Simulation: Record-breaking quantum computing simulations by Nvidia have boosted investor confidence.
- Valuation Concerns: Analysts are questioning whether NVDA is overvalued, citing customer debt and lagging stock price growth.
Positive sentiment indicators include:
- Record-breaking quantum computing simulation
- Dan Ives' buying opportunity call
- Compelling value opportunity due to earnings growth
Negative sentiment indicators include:
- AI selloff impacting stock price
- Customer debt concerns
- Lagging stock price growth
Historical Performance & Indicators
Our historical analysis reveals the following key findings:
- Price Trend Analysis: The 30-Day High of $239.24 and 30-Day Low of $210.96 indicate a range-bound market with some upward momentum.
- RSI Interpretation: The RSI is currently at 38.63, which indicates a neutral reading. However, the trend has been trending upward over the past few weeks, suggesting increasing momentum.
- Moving Average Analysis: The SMA analysis reveals that the 50-day SMA ($222.94) has been trending upward while the 200-day SMA ($203.12) is still below it. There is no Golden Cross pattern yet, but a potential emergence of a Golden Cross as the short-term EMA (12-day) has not crossed above the longer-term EMA (26-day).
- MACD Signal Interpretation: The MACD is currently at 3.77, indicating a bullish signal.
- Volatility Assessment: Nvidia's stock volatility has been relatively high over the observed period.
Key Takeaways
Based on our analysis, we have identified the following key takeaways:
- NVDA has formed a temporary low at $210.00, which may indicate a short-term bounce to $220.00 or higher.
- The medium-term trend remains bullish, with potential targets at $230.00 and above.
- Analysts are questioning whether NVDA is overvalued, citing customer debt and lagging stock price growth.
Risk Assessment
While our analysis suggests a positive outlook for NVDA, investors should be aware of the following risks:
- High Volatility: Nvidia's stock has been relatively volatile over the past year.
- Overvaluation Concerns: Analysts are questioning whether NVDA is overvalued, citing customer debt and lagging stock price growth.
- AI Selloff Impact: The AI selloff may lead to short-term price fluctuations.
Conclusion
In conclusion, our comprehensive analysis suggests that Nvidia's stock (NVDA) has a mixed outlook. While the technical indicators suggest a bullish trend, the news and market sentiment reveal concerns about overvaluation and AI selloff impact. Investors should exercise caution and monitor the stock's performance closely before making any investment decisions.
Recommendation
Based on this analysis, investors may consider:
- Buying Nvidia's stock for a short-term trade (target price: $230-$240)
- Holding or adding to existing positions if the long-term trend is believed to be bullish
- Selling or reducing exposure if the RSI drops below 30 or the MACD turns bearish
Please note that this analysis should not be considered investment advice and individual investors should consult with financial advisors before making any trading decisions.
---
Analyst Summary by Malik Abualzait
Based on comprehensive analysis of technical indicators, market news, and historical performance, Nvidia (NVDA) presents a HOLD signal with moderate conviction.
Key Factors:
- MACD positive (bullish momentum)
Current Status:
- Price: $217.09
- Change: N/A%
- RSI: 38.63
This analysis is based on automated technical analysis and should not be considered as financial advice. Always conduct your own research and consult with a financial advisor before making investment decisions.
Comments
Post a Comment