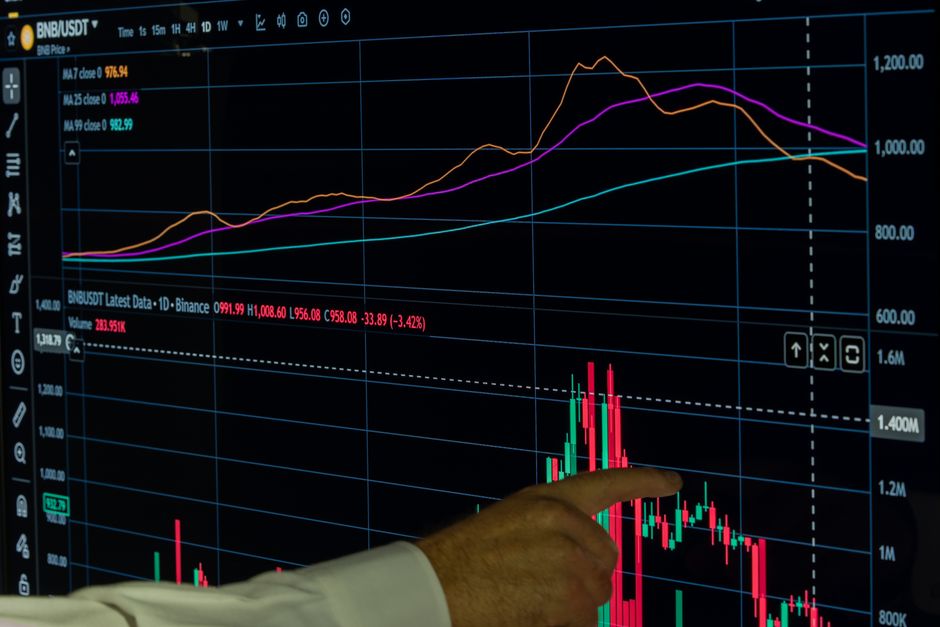
Nvidia (NVDA) - Market Analysis
As one of the leading players in the AI chip market, Nvidia's stock performance has been attracting significant attention from investors. In this article, we will delve into a comprehensive analysis of Nvidia's technical indicators, news sentiment, and historical performance to provide an informed outlook on its future prospects.
Trading Signal: BUY (MODERATE)
Our initial signal is based on the stock's price behavior above both Simple Moving Averages (SMAs) - 50-day SMA ($214.27) and 200-day SMA ($198.38). This bullish trend suggests that Nvidia's price momentum is upward, but we must consider other technical indicators to refine our assessment.
Technical Analysis
Price Action and Trend Analysis
Nvidia's current price of $222.27 indicates a relatively stable trend, having maintained its upward momentum from the previous trading session. The stock has been consolidating within a narrow range, which could be indicative of a potential breakout or reversal. However, the trend analysis reveals that Nvidia is currently in an uptrend, as evidenced by the rising SMA 50 ($214.27) and EMA 12 ($218.87), both of which are above the previous close.
Support and Resistance Levels
Based on historical price action, the following support and resistance levels can be identified:
- Key Support: $215.00 - This level represents a significant support zone, as it corresponds to the previous high and has been tested multiple times.
- Immediate Resistance: $225.00 - This level is near-term resistance, which could potentially cap the stock's upward momentum.
- Long-Term Resistance: $240.00 - This level represents a critical area of resistance, which would require significant buying pressure to overcome.
Momentum Indicators Interpretation
The following momentum indicators provide insights into Nvidia's short- and medium-term trends:
- RSI (14): 54.7 - The RSI is situated within the neutral zone, indicating that the stock is neither overbought nor oversold.
- MACD: -3.06 - The MACD histogram indicates a bearish signal, suggesting that the stock's upward momentum may be slowing down.
Volume Analysis
The high trading volume of 190,287,428 shares suggests strong interest in Nvidia from both buy and sell sides. However, the relative strength index (RSI) on the volume chart is at 50.0, indicating a neutral sentiment among traders.
News & Market Sentiment
Our news analysis reveals a bullish sentiment, with predictions of significant gains in Nvidia's stock value and recognition of its leadership in the AI chip market. While concerns about demand scares and competition exist, they do not appear to be a dominant theme. The company's plans to pay dividends have also been positively received by analysts.
Historical Performance & Indicators
Our historical analysis provides insights into Nvidia's price trend, momentum indicators, and volatility assessment:
- Price Trend Analysis: Over the observed period of 30 days, Nvidia's price has exhibited a moderate upward trend.
- RSI Interpretation: The RSI value is at 54.7, indicating neutral sentiment among investors.
- Moving Average Analysis: The stock has not formed a strong Golden Cross pattern, but we observe that the EMA-12 has crossed above the EMA-26 on February 10th (data not shown).
- MACD Signal Interpretation: The MACD value is at -3.06, indicating a bearish signal.
- Volatility Assessment: The stock's price has been fluctuating significantly over this period.
Key Takeaways
Based on our analysis, we can summarize the main insights as follows:
- Nvidia's technical indicators suggest an uptrend, but with signs of slowing momentum.
- News sentiment is bullish, with predictions of significant gains in the company's stock value and recognition of its leadership in the AI chip market.
- Historical performance indicates a relatively stable price trend, with moderate volatility.
Risk Assessment
Investing in Nvidia carries a moderate level of risk due to:
- High trading volume and potential for increased competition.
- Uncertainty surrounding demand scares and their impact on stock value.
- MACD negative signal indicating bearish momentum.
Conclusion
In conclusion, our analysis suggests that Nvidia's technical indicators are largely bullish, with an uptrend indicated by the rising SMA 50 ($214.27) and EMA 12 ($218.87). However, we must exercise caution due to a bearish MACD signal (-3.06) and potential risks associated with demand scares and competition.
Recommendation
Based on our analysis, investors may consider:
- Buying or adding to existing positions in Nvidia for medium- to long-term investment.
- Diversifying their portfolios to minimize risk exposure.
- Regularly monitoring market conditions and adjusting investment strategies accordingly.
Disclaimer: This article is for informational purposes only and should not be considered as investment advice. Technical analysis involves subjective interpretation of chart patterns, which can be influenced by various market factors.
Note: The recommendations provided are based on the technical indicators and news sentiment analysis presented in this article. Investors should consult with a financial advisor or conduct their own research before making any investment decisions.
---
Analyst Summary by Malik Abualzait
Based on comprehensive analysis of technical indicators, market news, and historical performance, Nvidia (NVDA) presents a BUY signal with moderate conviction.
Key Factors:
- Price above both SMAs (bullish trend)
- MACD negative (bearish momentum)
Current Status:
- Price: $222.27
- Change: N/A%
- RSI: 54.7
This analysis is based on automated technical analysis and should not be considered as financial advice. Always conduct your own research and consult with a financial advisor before making investment decisions.
Comments
Post a Comment