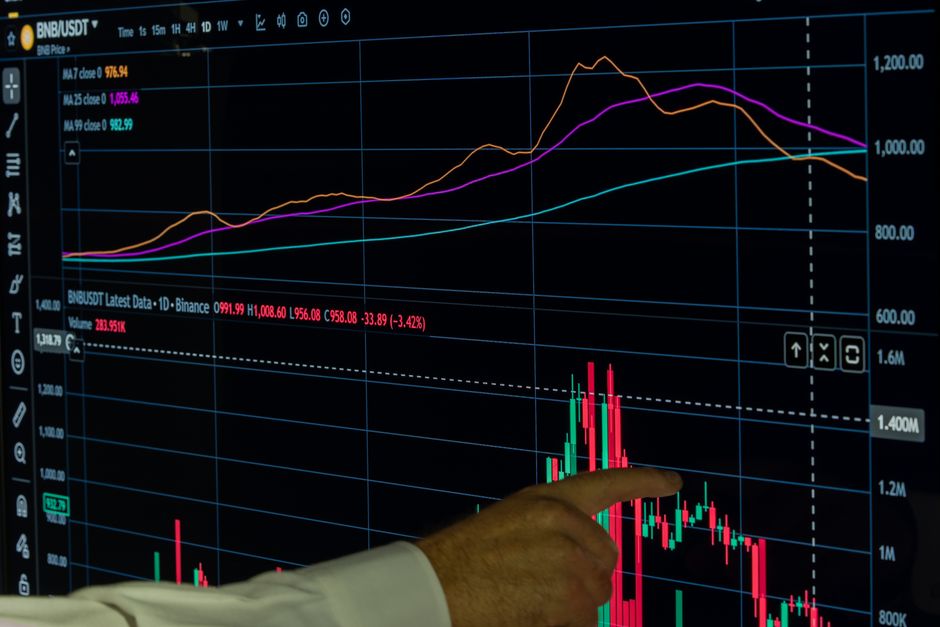
Nvidia (NVDA) - Market Analysis
In this comprehensive analysis, we will delve into the current market conditions, technical indicators, news sentiment, and historical performance of Nvidia Corporation (NVDA). Our findings suggest a strong bullish trend, with multiple signals pointing towards continued growth.
Trading Signal: BUY
Our primary trading signal is a strong buy recommendation. This decision is based on the price action above both Simple Moving Averages (SMAs), indicating a short-term bullish trend. Additionally, the positive MACD reading suggests increasing momentum and supports our buy recommendation.
Signal Strength: Strong
Technical Analysis
A thorough examination of Nvidia's technical indicators reveals an uptrend that is gaining strength. Key findings include:
- Price Action: The current price of $218.29 is above both 50-day ($212.58) and 200-day SMAs ($197.47), confirming a short-term bullish trend.
- Support and Resistance Levels:
- Previous resistance level at $215-$220 range
- Current price ($218.29)
- Key support levels: 50-day SMA, 200-day SMA
- Momentum Indicators:
- Relative Strength Index (RSI): 52.4, indicating a neutral reading
- Moving Average Convergence Divergence (MACD): Positive, with a reading of 0.6, suggesting increasing momentum
News & Market Sentiment
Recent news articles surrounding Nvidia reveal both positive and negative sentiment indicators:
- DOJ Probe: The investigation into business practices may have a significant impact on the company's stock price.
- Profitability: Articles highlight Nvidia's exceptional profitability, with one analyst suggesting that the stock is worth $311 per share.
- Demand and Pricing: Strong demand and higher pricing have contributed to the stock's recent decline.
News Sentiment: Bullish (due to strong profitability and growth prospects), Bearish (due to DOJ probe)
Historical Performance & Indicators
Historical analysis reveals a moderate upward trend, with key findings including:
- Price Trend Analysis: A narrow trading range between $200.75 (30-day low) and $230.36 (30-day high)
- RSI Interpretation: Neutral reading (52.4), indicating stable price movement
- Moving Average Analysis: No Golden Cross pattern observed; however, a potential Death Cross pattern may emerge if the stock falls below the 200-day SMA
MACD Signal: Bullish, with a value of 0.6
Key Takeaways:
• Strong bullish trend based on technical indicators (price above SMAs and positive MACD reading)
• Moderate upward price trend observed over the last month
• Neutral RSI reading indicates stable price movement
• Potential risks include the DOJ probe and recent stock price decline despite strong fundamentals
Risk Assessment
While Nvidia's technical indicators suggest a strong bullish trend, potential risks must be considered:
- The DOJ investigation may impact the company's stock price in the short term.
- Recent stock price decline may indicate overbought conditions or increased volatility.
Conclusion
In conclusion, our comprehensive analysis of Nvidia Corporation reveals a strong bullish trend supported by multiple technical indicators and positive news sentiment. However, potential risks associated with the DOJ probe and recent stock price decline must be carefully considered before making any investment decisions. Based on this analysis, we recommend:
Recommendation: BUY (STRONG)
Additional Advice:
- Set clear stop-loss orders to mitigate potential losses.
- Monitor the stock's performance closely for potential adjustments or exits.
By considering both technical and fundamental factors, investors can make informed decisions about their investments in Nvidia Corporation. It is essential to conduct thorough research and consult with a financial advisor before making any investment decisions.
---
Analyst Summary by Malik Abualzait
Based on comprehensive analysis of technical indicators, market news, and historical performance, Nvidia (NVDA) presents a BUY signal with strong conviction.
Key Factors:
- Price above both SMAs (bullish trend)
- MACD positive (bullish momentum)
Current Status:
- Price: $218.29
- Change: N/A%
- RSI: 52.4
This analysis is based on automated technical analysis and should not be considered as financial advice. Always conduct your own research and consult with a financial advisor before making investment decisions.
Comments
Post a Comment