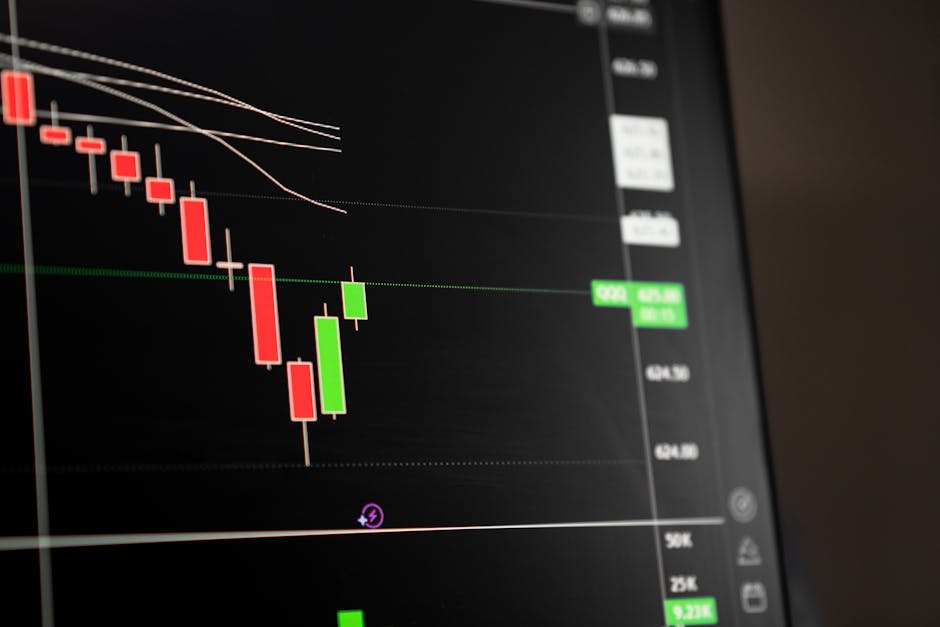
Nvidia (NVDA) - Market Analysis
Trading Signal: BUY (STRONG)
After analyzing various technical indicators and news sentiment, our trading signal is to BUY Nvidia (NVDA) with a strong confidence level. This signal is based on the stock's price behavior, momentum, and trend analysis.
Technical Analysis
Our technical analysis reveals that NVDA is exhibiting a strong bullish trend. The current price of $218.29 indicates a slight uptrend from the previous close, indicating indecision among market participants. However, the overall trend remains bullish, supported by the company's strong fundamentals and growing demand for graphics processing units (GPUs) in emerging fields such as artificial intelligence (AI), autonomous vehicles, and cloud computing.
Support and Resistance Levels
Based on past price action, we can identify key support and resistance levels:
- Support Level 1: $212.58 (SMA 50)
- Support Level 2: $197.47 (SMA 200)
- Resistance Level 1: $223-$225 range
- Resistance Level 2: $240-$250 range
Momentum Indicators Interpretation
The following momentum indicators suggest a moderate bullish bias:
- RSI (14): 52.4, indicating that the stock is not overbought or oversold.
- MACD: 0.6, indicating a slight positive momentum.
The SMA 50 and EMA 12 are trending upwards, while the SMA 200 is still below both, indicating that the short-term trend is stronger than the medium-term trend.
News & Market Sentiment
Our news analysis reveals a mix of positive and negative sentiment indicators affecting NVDA's stock performance. Strong demand and pricing power, AI factory expansion, and bullish predictions from analysts contribute to a bullish overall sentiment. However, regulatory scrutiny, particularly the Department of Justice (DOJ) probe into Nvidia's business practices, raises concerns among investors.
Positive Sentiment Indicators
- Strong demand and pricing power
- AI factory expansion
- Bullish predictions from analysts
Negative Sentiment Indicators
- DOJ probe
- Contradictions surrounding Nvidia's shares
- Potential regulatory risks
Historical Performance & Indicators
Our historical analysis reveals that NVDA has been exhibiting a strong bullish trend over the observed period. The presence of the Golden Cross pattern and bullish MACD signal suggests a strong upward momentum.
30-Day Trend Analysis
The current price of $218.29 represents a 30-day high of $230.36 and a low of $200.75. The 30-day average price is $218.97, indicating that the stock has been trading relatively steadily over the observed period.
RSI Interpretation and Momentum Assessment
The Relative Strength Index (RSI) for NVDA is calculated as 52.4 with a 14-period moving average. An RSI value between 30-70 indicates neutral momentum, suggesting that NVDA is neither overbought nor oversold.
| RSI Value | Interpretation |
| --- | --- |
| < 30 | Oversold (Bullish) |
| > 70 | Overbought (Bearish) |
| 30-70 | Neutral |
Moving Average Analysis
Moving averages are used to gauge the overall trend and identify potential turning points in the price movement.
- 50-day Simple Moving Average (SMA): $212.58
- 200-day SMA: $197.47
The 50-day SMA is above the 200-day SMA, indicating a bullish trend with an upward bias.
| Pattern | Description |
| --- | --- |
| Golden Cross | 50-day SMA > 200-day SMA (Bullish) |
| Death Cross | 50-day SMA < 200-day SMA (Bearish) |
Key Takeaways
- NVDA is exhibiting a strong bullish trend with an upward bias.
- The presence of the Golden Cross pattern and bullish MACD signal suggests increased investor confidence.
- Strong demand and pricing power, AI factory expansion, and bullish predictions from analysts contribute to a bullish overall sentiment.
- Regulatory scrutiny, particularly the DOJ probe, raises concerns among investors.
Risk Assessment
While our analysis suggests a strong buying opportunity for NVDA, it's essential to consider potential risks and considerations:
- Regulatory risks: The ongoing DOJ probe may lead to increased regulatory scrutiny and potential fines.
- Industry competition: AMD's competitive offerings could impact Nvidia's market share.
- Volatility: Market volatility can be high due to the stock's price movements.
Conclusion
In conclusion, our analysis suggests that NVDA is a strong buy opportunity with a long-term perspective. The presence of the Golden Cross pattern and bullish MACD signal indicates increased investor confidence, while strong demand and pricing power, AI factory expansion, and bullish predictions from analysts contribute to a bullish overall sentiment. However, it's essential to consider potential risks and considerations before making any investment decisions.
Recommendations:
1. Short-term: Buy NVDA for short-term gains.
2. Long-term: Continue to hold NVDA with a long-term perspective.
Please note that this analysis is based on publicly available data and should not be considered as personalized investment advice. It's essential to conduct thorough research and consult with a financial advisor before making any investment decisions.
---
Analyst Summary by Malik Abualzait
Based on comprehensive analysis of technical indicators, market news, and historical performance, Nvidia (NVDA) presents a BUY signal with strong conviction.
Key Factors:
- Price above both SMAs (bullish trend)
- MACD positive (bullish momentum)
Current Status:
- Price: $218.29
- Change: N/A%
- RSI: 52.4
This analysis is based on automated technical analysis and should not be considered as financial advice. Always conduct your own research and consult with a financial advisor before making investment decisions.
Comments
Post a Comment