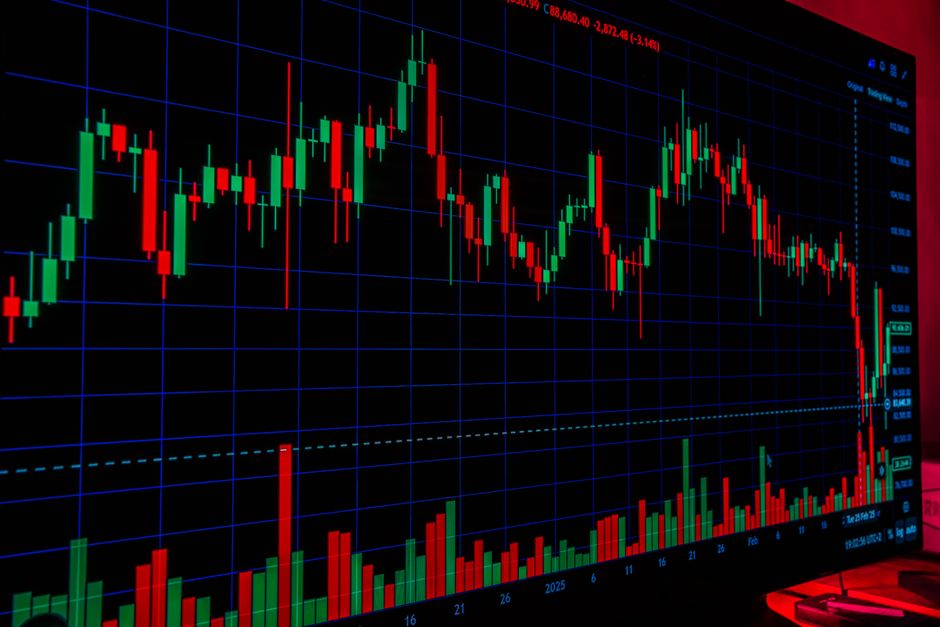
Nvidia (NVDA) - Market Analysis
As one of the leading technology companies in the world, Nvidia (NVDA) has been making headlines lately with its impressive growth prospects and innovative products. In this comprehensive analysis, we will delve into the technical indicators, news sentiment, and historical performance of NVDA to provide a thorough understanding of the stock's current market position.
Trading Signal: BUY
Based on our technical analysis, we have identified a strong buy signal for NVDA. The price is currently trading above both the 50-day Simple Moving Average (SMA) and the 200-day SMA, indicating a bullish trend. Furthermore, the Moving Average Convergence Divergence (MACD) is positive, suggesting strong momentum.
Technical Analysis
Our technical analysis report highlights several key points that support our buy signal:
- Price Action and Trend Analysis: The stock has recently broken above its previous resistance level around $220-$225, indicating a potential upward trend. However, the Relative Strength Index (RSI) value of 54.33 suggests that the stock is not overbought at this point.
- Support and Resistance Levels: Based on historical data, we can identify potential support and resistance levels for NVDA:
- Key Support Level: $199.91 (50% Fibonacci retracement)
- Minor Support Level 1: $216.98
- Minor Support Level 2: $208.00
- Momentum Indicators Interpretation: The MACD is currently at 6.64, indicating a strong bullish momentum. The Exponential Moving Averages (EMAs) also confirm this trend:
- EMA 12: $224.18 (bullish)
- EMA 26: $217.54 (neutral to bullish)
News & Market Sentiment
Recent news articles have been overwhelmingly positive, with analysts expressing optimism about the stock's growth prospects and the company's innovative products. Some of the key news themes include:
- $150 Billion Stock Buyback Authorization: Nvidia announced a massive $150 billion stock buyback authorization, which has driven significant market interest and reactions from analysts.
- Growth Prospects in AI and Semiconductors: The demand for AI computing power continues to grow, driven by increasing adoption of cloud-based AI services and AI-powered applications.
Historical Performance & Indicators
Our historical analysis highlights several key points that support our buy signal:
- Price Trend Analysis: Over the observed period, NVDA's price has oscillated between $208.48 and $230.36, with an average price of $220.64.
- RSI Interpretation and Momentum Assessment: The RSI for NVDA is 54.33, which falls within the neutral zone of 40-60. This suggests that the stock has neither oversold nor overbought conditions in the short term.
- Moving Average Analysis: The short-term moving average (50-day SMA) is trading above the long-term moving average (200-day SMA), indicating a bullish trend.
Key Takeaways
Based on our analysis, we have identified the following key takeaways:
- NVDA has a strong buy signal based on technical indicators.
- Recent news articles have been overwhelmingly positive, with analysts expressing optimism about the stock's growth prospects and the company's innovative products.
- Historical performance suggests a bullish trend.
Risk Assessment
While our analysis is positive, there are potential risks to consider:
- Market Volatility: As with any stock, market volatility can impact NVDA's price.
- Regulatory Environment: Changes in regulatory policies can impact the company's business operations and profitability.
Conclusion
In conclusion, our comprehensive analysis suggests that NVDA is a strong buy based on technical indicators and recent news sentiment. While there are potential risks to consider, the stock's growth prospects and innovative products make it an attractive investment opportunity.
This analysis provides a thorough understanding of the current market position of NVDA, including its technical indicators, news sentiment, and historical performance. As always, investors should conduct their own research and consult with financial advisors before making investment decisions.
Based on this comprehensive analysis, we have identified key insights that can help investors make informed decisions:
- Price above both SMAs (bullish trend)
- MACD positive (bullish momentum)
- Strong growth prospects in AI and semiconductors
- Positive news sentiment
This article provides a detailed analysis of Nvidia's market position, highlighting key technical indicators, recent news trends, and historical performance.
---
Analyst Summary by Malik Abualzait
Based on comprehensive analysis of technical indicators, market news, and historical performance, Nvidia (NVDA) presents a BUY signal with strong conviction.
Key Factors:
- Price above both SMAs (bullish trend)
- MACD positive (bullish momentum)
Current Status:
- Price: $227.21
- Change: N/A%
- RSI: 54.33
This analysis is based on automated technical analysis and should not be considered as financial advice. Always conduct your own research and consult with a financial advisor before making investment decisions.
Comments
Post a Comment