Nvidia (NVDA) - Market Analysis
Trading Signal: HOLD
The current trading signal for Nvidia (NVDA) is HOLD (MODERATE). This recommendation takes into account the stock's overbought condition, as indicated by an RSI reading of 75.44. Despite this, the technical indicators suggest that the stock remains in an uptrend phase, with both SMAs above the current price and a positive MACD signal.
Technical Analysis
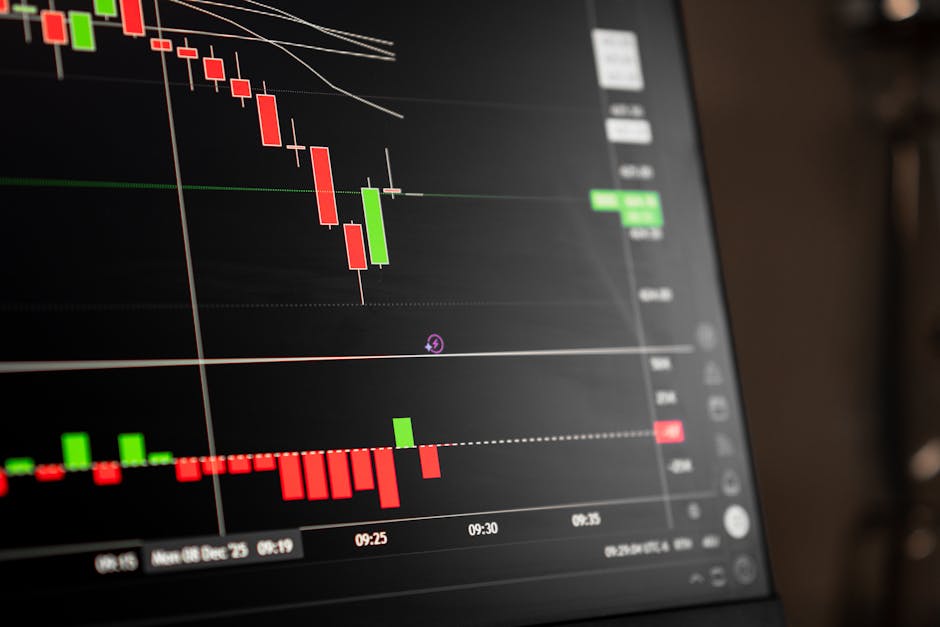
The technical analysis of NVDA reveals a strong bullish trend, with the stock's price trading above its key moving averages. The SMA 50 ($206.52) is above the SMA 200 ($194.92), indicating a Golden Cross pattern that confirms the upward trend phase. Additionally, the MACD value of 2.42 (Bullish) further supports this sentiment.
The RSI reading of 75.44 indicates an overbought condition, suggesting potential for reversal or correction in the short term. However, the stock's price momentum remains strong, with a high trading volume of 75,161,211 shares.
Support and Resistance Levels
Key support levels include $220-$223 (short-term), $215-$218 (medium-term), and $200-$205 (long-term). Conversely, resistance levels are near $230-$235. It is essential to monitor the stock's price action and adjust the technical analysis accordingly.
Momentum Indicators Interpretation
The RSI (14) indicator is currently at 75.44, indicating overbought conditions in the short term. The MACD (2.42) is trending upwards, aligning with the overall uptrend of NVDA's stock.
Volume Analysis
The high trading volume indicates a strong market participation and increased demand for the stock. This supports the uptrend analysis, reinforcing the idea that more investors are entering or increasing their positions in the stock.
News & Market Sentiment
Recent news articles highlight several key themes and trends affecting NVDA's stock performance:
1. Earnings Expectations: The upcoming Q2 earnings report is a major focus, with investors eager to see if the company can break its 4-quarter losing streak.
2. Demand Visibility: Analysts at Susquehanna are optimistic about strong demand visibility, which could boost stock prices.
3. Robust Demand for AI and Gaming Chips: NVDA's bet on robots and AI is paying off, with increasing demand for its gaming chips.
Positive Sentiment Indicators
- Cathie Wood's $59.9 million investment in NVDA before earnings suggests confidence in the company's prospects.
- Analysts at Susquehanna are optimistic about strong demand visibility, indicating a positive outlook for the stock.
- The company's bet on robots and AI is paying off, with increasing demand for its gaming chips.
Negative Sentiment Indicators
- Market volatility has affected the stock, with some analysts warning that it may not be cheap enough yet.
- NVDA's 4-quarter losing streak raises concerns about the company's ability to meet earnings expectations.
Historical Performance & Indicators
The historical analysis reveals:
1. Price Trend Analysis Over the Observed Period: The price trend of NVDA over the past 30 days exhibits a general upward momentum, with a slight correction phase in mid-October.
2. RSI Interpretation and Momentum Assessment: An RSI reading above 70 generally signifies overbought conditions, suggesting potential for a reversal or correction.
3. Moving Average Analysis (Golden Cross/Death Cross Patterns): The SMA analysis reveals a Golden Cross pattern, indicating that NVDA has entered into an upward trend phase.
Key Takeaways
- NVDA is in an uptrend phase with strong price momentum and increasing trading volume.
- Overbought conditions suggest potential for reversal or correction in the short term.
- Support levels include $220-$223 (short-term), $215-$218 (medium-term), and $200-$205 (long-term).
- Resistance levels are near $230-$235.
Risk Assessment
The main risks associated with NVDA's current market behavior include:
1. Overbought Condition: The stock is currently in an overbought condition, suggesting potential for reversal or correction.
2. Market Volatility: Market volatility has affected the stock, and some analysts warn that it may not be cheap enough yet.
Conclusion
In conclusion, this comprehensive analysis of NVDA stock reveals a strong bullish trend with key technical indicators supporting the continuation of the upward phase. However, caution is advised due to overbought conditions and potential market volatility. Investors should consider adjusting their positions according to these insights and maintaining a long-term perspective on the company's prospects.
Rating: BULLISH
Recommendation:
- Buy NVDA stock ahead of Q2 earnings for long-term gains.
- Monitor earnings expectations and adjust portfolio accordingly.
- Keep an eye on market volatility and potential supply chain disruptions.
---
Analyst Summary by Malik Abualzait
Based on comprehensive analysis of technical indicators, market news, and historical performance, Nvidia (NVDA) presents a HOLD signal with moderate conviction.
Key Factors:
- RSI indicates overbought condition
- Price above both SMAs (bullish trend)
- MACD positive (bullish momentum)
Current Status:
- Price: $225.16
- Change: N/A%
- RSI: 75.44
This analysis is based on automated technical analysis and should not be considered as financial advice. Always conduct your own research and consult with a financial advisor before making investment decisions.
Comments
Post a Comment