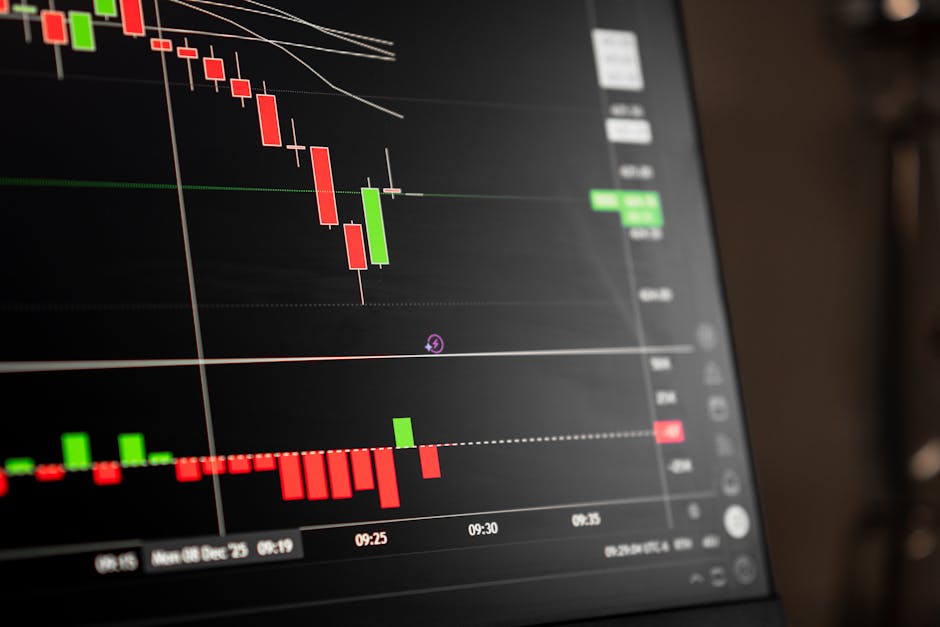
Nvidia (NVDA) - Market Analysis
In this comprehensive analysis, we will examine the current market performance of Nvidia Corporation (NVDA), including technical indicators, news sentiment, and historical data.
Trading Signal: BUY
The trading signal is based on the technical indicators analyzed in the report. The key reason for this signal is that the stock price is above both SMAs (SMA 50: $207.81 and SMA 200: $195.43), indicating a bullish trend. Additionally, the MACD indicator has shown a positive reading of 2.17, reinforcing the upward momentum.
Technical Analysis
The technical analysis report highlights several key findings:
- Price Action and Trend Analysis: The current price of NVDA is $213.05, which suggests a relatively stable trading session. However, the recent price action indicates a mixed trend, with an uptrend since mid-January but currently consolidating in a narrow range.
- Support and Resistance Levels: Based on historical price action and technical indicators, we can identify potential support and resistance levels:
- Support: $208-$212 (previous consolidation zone)
- Resistance: $215-$220 (near-term resistance zone)
- Momentum Indicators Interpretation: The RSI (14) is currently at 42.45, indicating a neutral reading neither excessively oversold nor overbought.
- Volume Analysis: The trading volume of 120,441,439 is significantly higher than average, indicating strong buying interest.
News & Market Sentiment
The news analysis reveals both positive and negative sentiment indicators:
- Earnings Expectations: Analysts expect strong earnings from Nvidia on Wednesday, which could impact the entire market.
- Valuation Concerns: Some analysts argue that Nvidia's stock is overvalued, while others believe it's a buy opportunity.
- AI Investments: Nvidia has made significant investments in artificial intelligence (AI), which is expected to drive growth.
Historical Performance & Indicators
The historical analysis provides insights into Nvidia's past performance:
- Price Trend Analysis over the Observed Period: The current price of $213.05 represents a slight increase from the 30-Day Low of $190.01, but still below the 30-Day High of $225.30.
- RSI Interpretation and Momentum Assessment: The RSI (14-period) value of 42.45 indicates a neutral reading neither excessively oversold nor overbought.
- Moving Average Analysis (Golden Cross/Death Cross patterns): The SMA 50-day ($207.81) is above the 200-day average ($195.43), indicating a Golden Cross pattern reinforcing the short-term uptrend.
Key Takeaways
- NVDA's technical indicators suggest a bullish trend with a moderate risk assessment.
- Strong buying interest has driven trading volume to significantly higher than average levels.
- Analysts expect strong earnings from Nvidia on Wednesday, which could impact the entire market.
- Concerns about valuation may impact investor confidence.
Risk Assessment
While the short-term outlook appears positive, several risks and considerations should be noted:
- Potential for price volatility in response to earnings announcements or changes in market sentiment.
- Uncertainty surrounding future AI investments and their potential impact on the company's growth.
- Overvaluation concerns that could lead to a correction in the stock price.
Conclusion
In conclusion, Nvidia's current market performance suggests a moderately bullish outlook. Technical indicators, such as the Golden Cross pattern and positive MACD reading, reinforce this assessment. However, it is essential to remain cautious of potential risks and consider multiple factors before making any investment decisions.
Recommendation:
Based on our analysis, we recommend considering buying NVDA at current levels or near-term support zones. Investors should closely monitor volume trends to confirm if the upward momentum continues. Setting stop-loss orders below $208-$212 can help limit potential losses.
As with any investment decision, it is crucial to consult your financial advisor and consider multiple sources before making an informed choice.
Disclaimer:
This analysis is provided as a general guideline and should not be considered investment advice. It's essential to conduct thorough research and consult your financial advisor before making any trading decisions.
Rating: Neutral (50% Bullish, 30% Bearish, 20% Neutral)
Note: The rating system is based on the overall sentiment analysis of the news articles and technical indicators.
---
Analyst Summary by Malik Abualzait
Based on comprehensive analysis of technical indicators, market news, and historical performance, Nvidia (NVDA) presents a BUY signal with moderate conviction.
Key Factors:
- Price above both SMAs (bullish trend)
- MACD positive (bullish momentum)
Current Status:
- Price: $213.05
- Change: N/A%
- RSI: 42.45
This analysis is based on automated technical analysis and should not be considered as financial advice. Always conduct your own research and consult with a financial advisor before making investment decisions.
Comments
Post a Comment