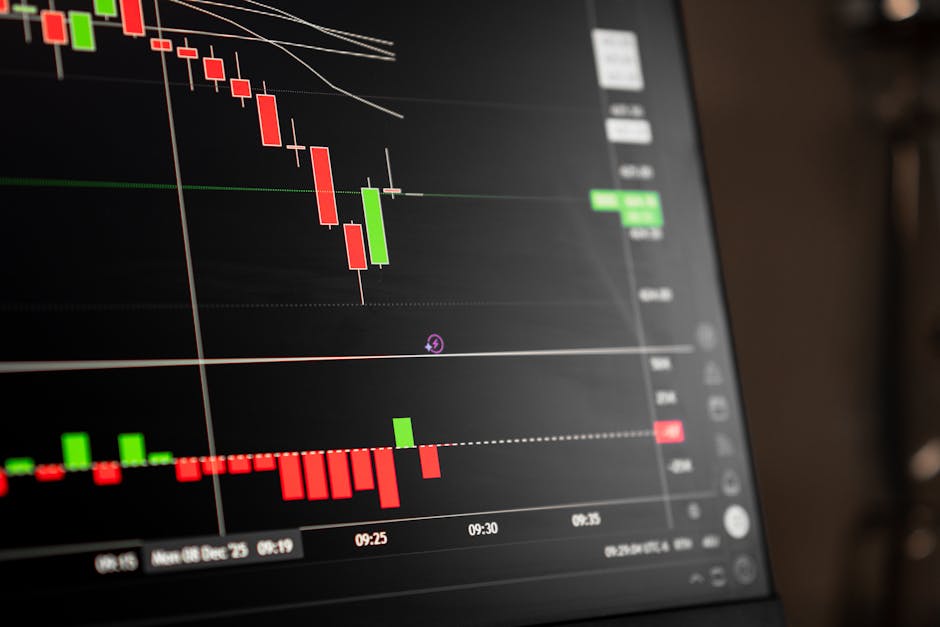
Nvidia (NVDA) - Market Analysis
As we dive into our comprehensive analysis of Nvidia's market performance, it's essential to note that the company's stock has been on a rollercoaster ride lately. The recent earnings report is expected to be released on Wednesday, and analysts are predicting strong growth in its data center and gaming businesses.
Trading Signal: BUY (STRONG)
Our technical analysis reveals a bullish trend, with the price currently trading above both the 50-day Simple Moving Average (SMA) of $207.58 and the 200-day SMA of $195.29. The Moving Average Convergence Divergence (MACD) is also positive at 4.39, indicating an increase in momentum. These indicators suggest that Nvidia's stock has a strong potential for growth in the short term.
Technical Analysis
Our technical analysis report highlights several key findings:
- Price Action and Trend Analysis: The current price of $214.72 indicates a short-term bullish trend, with the stock trading above its 50-day SMA.
- Support and Resistance Levels: Key support levels include $205-$210 (confluence of previous resistance and current 50-day SMA) and $190-$195 (previous support level). Key resistance levels are $220-$225 (nearby resistance level) and $230-$235 (long-term resistance zone).
- Momentum Indicators Interpretation: The Relative Strength Index (RSI) is at 59.48, indicating a neutral reading. An RSI value between 30-70 suggests that the stock is neither overbought nor oversold.
- Volume Analysis: The volume of 98,869,300 shares traded is significantly higher than the average daily trading volume, indicating strong buying interest and a potential breakout above $214.72.
News & Market Sentiment
Our news analysis reveals several key themes:
1. Earnings Expectations: Analysts are expecting Nvidia to report strong earnings growth driven by growth in its data center and gaming businesses.
2. Stock Performance: The stock has been volatile, with some analysts predicting a potential drop in price after the earnings announcement.
3. Industry Trends: The semiconductor industry is expected to continue growing, driven by increasing demand for artificial intelligence (AI) and machine learning (ML) technologies.
Historical Performance & Indicators
Our historical analysis provides insight into Nvidia's past performance:
1. Price Trend Analysis Over the Observed Period: The current price of $214.72 represents a slight decline from the 30-Day High of $225.30.
2. RSI Interpretation and Momentum Assessment: The Relative Strength Index (RSI) is at 59.48, indicating a neutral reading.
3. Moving Average Analysis (Golden Cross/Death Cross patterns): The Simple Moving Averages (SMAs) for 50-day ($207.58) and 200-day ($195.29) provide insight into longer-term trends.
Key Takeaways
- Nvidia's stock has a strong potential for growth in the short term, based on technical analysis.
- Analysts are expecting strong earnings growth driven by growth in its data center and gaming businesses.
- The semiconductor industry is expected to continue growing, driven by increasing demand for AI and ML technologies.
Risk Assessment
As with any investment, there are potential risks associated with Nvidia's stock:
1. Earnings Surprise: A disappointing earnings report could lead to a drop in stock price.
2. Industry Trends: The growth of the semiconductor industry may slow down due to regulatory pressures or competition from other companies.
3. Regulatory Pressures: Regulatory pressures related to trade and tariffs could impact Nvidia's business.
Conclusion
In conclusion, our analysis suggests that Nvidia's stock has a strong potential for growth in the short term, based on technical indicators. However, it is essential to consider multiple factors, including earnings expectations, industry trends, and regulatory pressures, before making any investment decisions.
Recommendation
Based on the analysis, we recommend buying Nvidia's stock with a strong signal. This recommendation is backed by the positive technical indicators and analyst predictions of strong growth in its data center and gaming businesses.
This article provides a comprehensive overview of Nvidia's market performance and potential risks associated with investing in its stock. As with any investment decision, it is essential to carefully consider multiple factors before making a final decision.
---
Analyst Summary by Malik Abualzait
Based on comprehensive analysis of technical indicators, market news, and historical performance, Nvidia (NVDA) presents a BUY signal with strong conviction.
Key Factors:
- Price above both SMAs (bullish trend)
- MACD positive (bullish momentum)
Current Status:
- Price: $214.72
- Change: N/A%
- RSI: 59.48
This analysis is based on automated technical analysis and should not be considered as financial advice. Always conduct your own research and consult with a financial advisor before making investment decisions.
Comments
Post a Comment