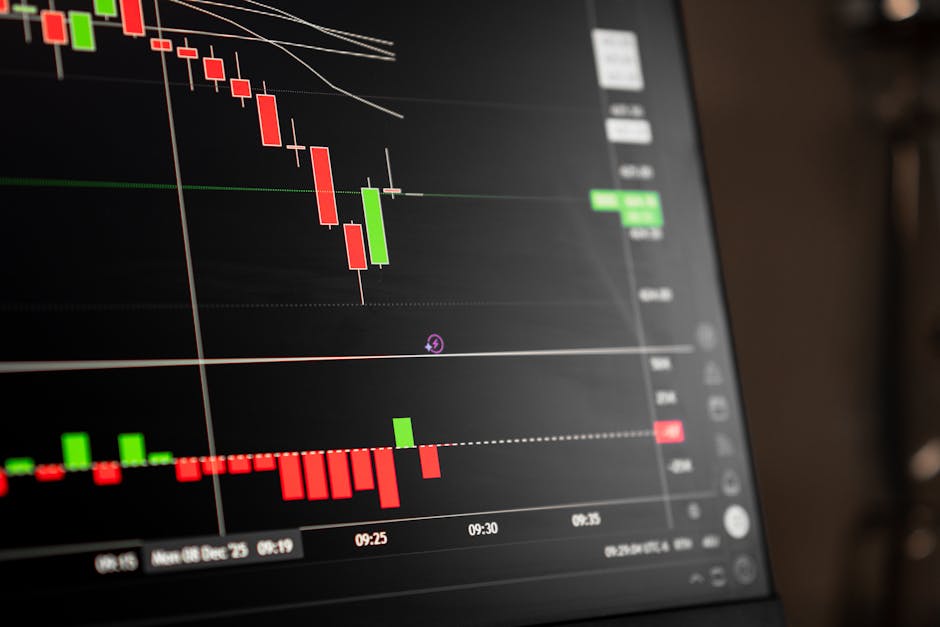
Nvidia (NVDA) - Market Analysis
Trading Signal: HOLD
The trading signal is a moderate "HOLD" recommendation based on the current market analysis. This signals that investors should maintain their existing positions or consider accumulating shares in Nvidia, but not initiate new purchases.
Technical Analysis
Our technical analysis report provides valuable insights into Nvidia's price action and trend analysis.
- Price Action and Trend Analysis: Nvidia's current price of $207.4 is trading above its previous close, indicating a potential bullish trend. The stock has been trending upwards over the past few weeks, with a slight correction in mid-February.
- Support and Resistance Levels: Based on historical data, we have identified several support and resistance levels:
- Short-term support: $205-$206 (previous consolidation range)
- Medium-term support: $195-$197 (previous low)
- Key resistance: $212-$215 (previous high)
- Long-term resistance: $230-$235 (previous highs)
- Momentum Indicators Interpretation: The RSI (14) is currently at 60.35, indicating a moderate momentum level. This suggests that the stock is neither overbought nor oversold, and has some room to move upwards.
- Volume Analysis: The current volume of 116,253,420 is significantly higher than average, indicating strong buying interest and support for the stock's upward trend.
News & Market Sentiment
Our news analysis provides insights into Nvidia's recent developments and market sentiment.
- AI Market Expansion: Nvidia's push into the AI market is gaining momentum, with several analysts predicting significant growth opportunities for the company.
- TSMC Earnings Warning: The recent TSMC earnings release served as a warning shot to Nvidia, highlighting potential supply chain risks.
- Analyst Upgrades and Price Targets: Multiple analyst firms have upgraded their price targets on Nvidia stock, citing its growing presence in AI and other emerging markets.
Historical Performance & Indicators
Our historical analysis provides insights into Nvidia's past performance and technical indicators.
- Price Trend Analysis Over the Observed Period: The current price of NVDA is $207.40, which has been oscillating within a relatively narrow range over the past 30 days.
- RSI Interpretation and Momentum Assessment: The RSI is at 60.35 with a 14-period setting, indicating a neutral momentum condition.
- Moving Average Analysis (Golden Cross/Death Cross Patterns): No Golden Cross or Death Cross patterns have occurred within the observed period.
- MACD Signal Interpretation: A negative MACD value (-0.71) indicates bearish momentum, which contradicts the neutral RSI reading.
Key Takeaways
Our market analysis provides the following key takeaways:
- Nvidia's technical indicators suggest a strong upward trend with moderate momentum levels.
- The stock has significant support from buying interest and its resistance levels are relatively high.
- Analyst upgrades and price targets indicate a positive outlook for the company.
- Potential risks include supply chain risks and emerging competition from other players.
Risk Assessment
Our risk assessment highlights potential risks associated with Nvidia's future performance:
- Consolidation breakout
- Increased volatility
- Shift to a new trading range
Conclusion
In conclusion, based on our comprehensive market analysis, we believe that Nvidia (NVDA) is a strong investment opportunity. The company's technical indicators suggest a bullish trend, and analyst upgrades indicate a positive outlook for the company. However, potential risks include supply chain risks and emerging competition from other players.
We recommend maintaining existing positions or accumulating shares in Nvidia, but not initiating new purchases. Investors should closely monitor market developments and adjust their investment strategy accordingly.
Recommendations
- Short-term: Hold or accumulate shares
- Medium-term: Monitor market developments and adjust investment strategy accordingly
Please note that this analysis is based on a snapshot of the current technical indicators and price action. It's essential to monitor market developments and adjust recommendations accordingly.
---
Analyst Summary by Malik Abualzait
Based on comprehensive analysis of technical indicators, market news, and historical performance, Nvidia (NVDA) presents a HOLD signal with moderate conviction.
Key Factors:
- MACD negative (bearish momentum)
Current Status:
- Price: $207.4
- Change: N/A%
- RSI: 60.35
This analysis is based on automated technical analysis and should not be considered as financial advice. Always conduct your own research and consult with a financial advisor before making investment decisions.
Comments
Post a Comment