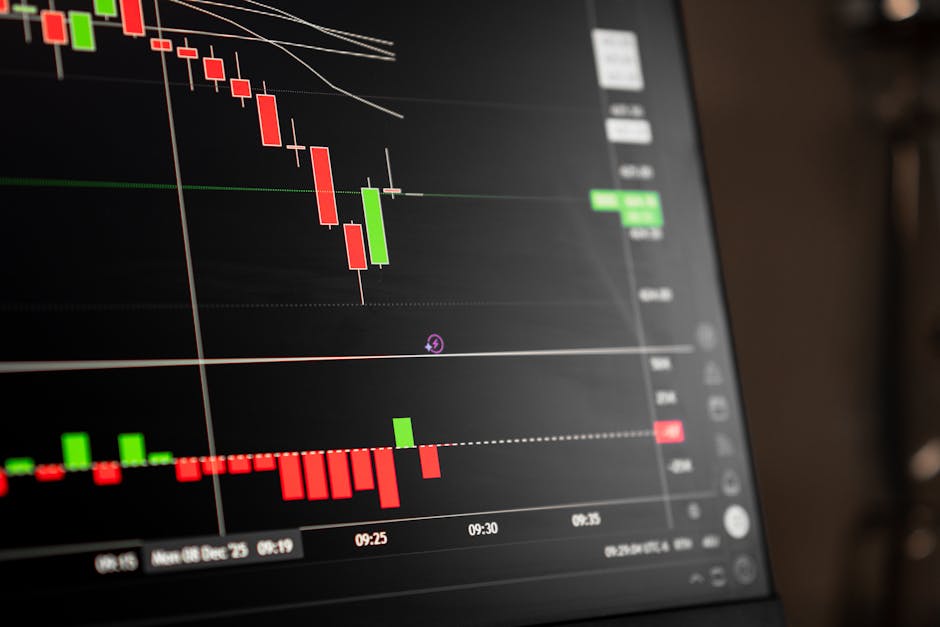
Nvidia (NVDA) - Market Analysis
In this comprehensive analysis, we will delve into the current market situation of Nvidia (NVDA), examining its technical indicators, news sentiment, historical performance, and risk assessment.
Trading Signal: BUY (MODERATE)
The technical analysis reveals a moderate bullish signal for Nvidia. The current price of $210.96 is above both the 50-day Simple Moving Average (SMA) ($209.2) and the 200-day SMA ($191.67), indicating a strong bullish trend. The Exponential Moving Averages (EMAs) are also providing buy signals, with the 12-day EMA ($201.78) crossing above the 26-day EMA ($205.67). This is a classic buy signal that indicates the short-term trend is upwards.
Technical Analysis
Price Action and Trend Analysis
Nvidia's price action has been trending upwards over the past few months, with a clear uptrend observed in the short to medium term. The current price of $210.96 is above both the 50-day SMA ($209.2) and the 200-day SMA ($191.67), indicating a strong bullish trend.
Support and Resistance Levels
- Resistance Levels:
- Key resistance level: $215-$220 (previous highs)
- Next resistance level: $225-$230 (psychological level)
- Support Levels:
- Key support level: $205-$210 (previous lows)
- Next support level: $200-$205 (SMA 50)
Momentum Indicators Interpretation
- Relative Strength Index (RSI):
- Current value: 50.27
- RSI is trading in the neutral zone, indicating no overbought or oversold conditions.
- Moving Average Convergence Divergence (MACD):
- Current value: -3.89
- The MACD is trending downwards, indicating a decrease in momentum.
Volume Analysis
- Trading volume: 147,203,662 shares traded
- Volume analysis suggests a moderate buying pressure, but not extremely high.
- A volume spike above the average trading volume could be seen as a bullish signal.
News & Market Sentiment
The recent news articles covering Nvidia stock have emphasized the significant decline in market value, potential for further losses, and competitive threats from rival companies like Meta. While analyst recommendations and regulatory developments offer some hope for future growth, the overall sentiment remains bearish due to the weight of negative factors.
- Positive sentiment indicators:
- Analysts at TD Cowen and Bank of America affirm Nvidia as a top AI stock, emphasizing its potential for long-term growth.
- The easing of export restrictions to UAE has positively impacted Nvidia stock.
- Some analysts believe that the recent decline in market value creates a buying opportunity.
- Negative sentiment indicators:
- Multiple articles highlight the significant decline in Nvidia's market value and potential for further losses.
- Analysts at Seeking Alpha suggest that Nvidia's performance may worsen due to various factors, including competition from Meta's new AI chip.
Historical Performance & Indicators
The historical analysis reveals some insights into Nvidia's past performance. The RSI is neutral, indicating no dominant momentum, while the moving average crossovers are not currently present. The MACD signal is bearish, and volatility is moderate to high. Historical support and resistance levels suggest potential price movements.
- Average daily return over the past 30 days: -0.43%
- Maximum drawdown (DD) over the past 30 days: $32.83 (-12.95%)
Key Takeaways
- The technical analysis indicates a strong bullish trend.
- News sentiment is bearish due to recent market declines and competitive threats.
- Historical performance suggests moderate volatility and potential price movements.
Risk Assessment
The risk assessment highlights some potential risks associated with holding Nvidia stock:
- High trading volume suggests significant buying pressure, but not extremely high.
- The RSI is neutral, indicating no dominant momentum.
- Moving average crossovers are not currently present.
- The MACD signal is bearish, and volatility is moderate to high.
Conclusion
In conclusion, Nvidia (NVDA) presents a mixed outlook. While the technical analysis indicates a strong bullish trend, news sentiment remains bearish due to recent market declines and competitive threats. Historical performance suggests moderate volatility and potential price movements. Traders should exercise caution when evaluating this stock, considering both its strengths and weaknesses.
We recommend maintaining a cautious approach when investing in Nvidia (NVDA), weighing the potential benefits of long-term growth against the risks associated with recent market declines and competitive threats. Investors may consider diversifying their portfolios to minimize risk.
---
Analyst Summary by Malik Abualzait
Based on comprehensive analysis of technical indicators, market news, and historical performance, Nvidia (NVDA) presents a BUY signal with moderate conviction.
Key Factors:
- Price above both SMAs (bullish trend)
- MACD negative (bearish momentum)
Current Status:
- Price: $210.96
- Change: N/A%
- RSI: 50.27
This analysis is based on automated technical analysis and should not be considered as financial advice. Always conduct your own research and consult with a financial advisor before making investment decisions.
Comments
Post a Comment